What Is a Heat Map?
A heat map is a graphical representation of data where values are expressed as colors.
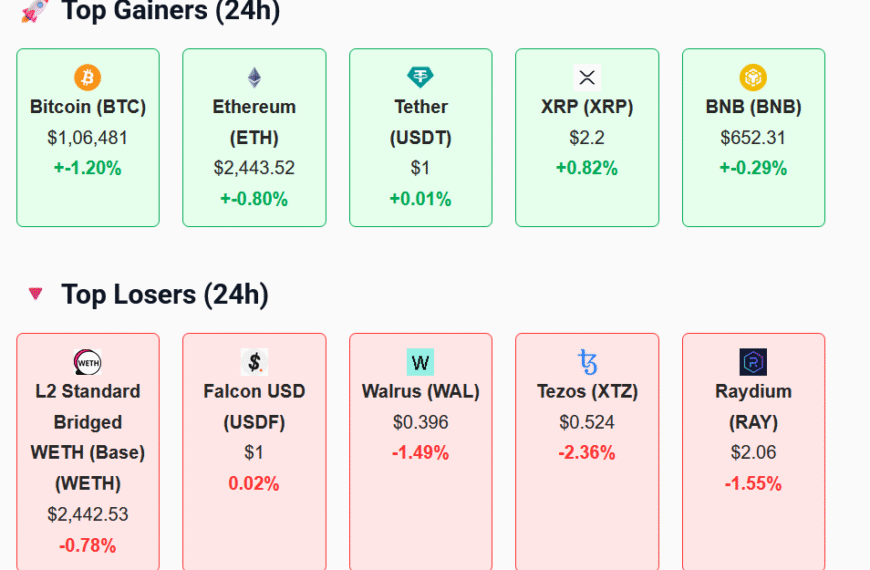
What is a Crypto Heatmap?
A Crypto Heatmap is a visual grid of top cryptocurrencies, where each token is shown as a box. The box’s color reflects its price change (green for gain, red for loss), and it displays real-time price, % change, and the token symbol. It helps users identify market trends at a glance.
How is the data in the heatmap updated?
CryptoView’s Heatmap pulls live data directly from CoinGecko and auto-refreshes every 60 seconds. No need to reload the page — you’re always seeing the most up-to-date prices and performance.
What do the box colors mean?
🟩 Green — Price increased in the last 24 hours
🟥 Red — Price dropped
⬜ Grey/Neutral — Little or no change This helps you spot bullish and bearish coins instantly.
How many coins are shown?
By default, the heatmap displays the top 20 cryptocurrencies by market cap. Future versions may allow toggling to view Top 50, altcoins only, or category-based filters.
Can I click on the tokens in the heatmap?
Currently, the heatmap is informational only — but upcoming versions will support clickable boxes that take you to a dedicated page for each token, including charts, news, and historical stats.
Where can I explore more live tools?
You can visit our full Market Tools Dashboard to view:
📉 Live Ticker
🟩 Crypto Heatmap (you’re here!)
🚀 Top Movers
📊 Sentiment Gauges (coming soon)
 By
By![Ultimate Crypto Ticker [Live] – Track BTC, ETH & Top Coins 24/7](https://cryptoview.live/wp-content/uploads/2025/07/image-1-870x570.png)


buy thc gummies online safely with discreet worldwide shipping
Caliente nuevos? New on Caliente, what does that mean? Are they offering special things for new customers? caliente nuevos